Create a Power BI Pie Chart | Power BI Pie Chart Multiple Values
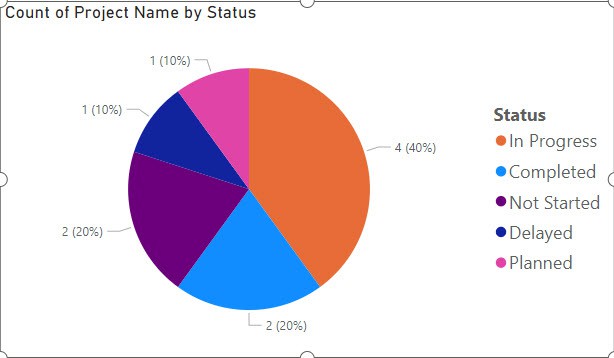
Pie charts in Power BI are typically used to represent the composition or distribution of a single categorical variable in your data. In other words, we would use a pie chart when we want to show how parts of a whole relate to each other. In this tutorial, we’ll learn how to create a Pie … read more…
