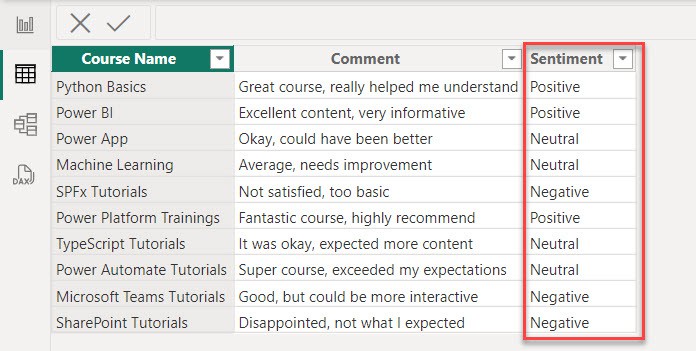
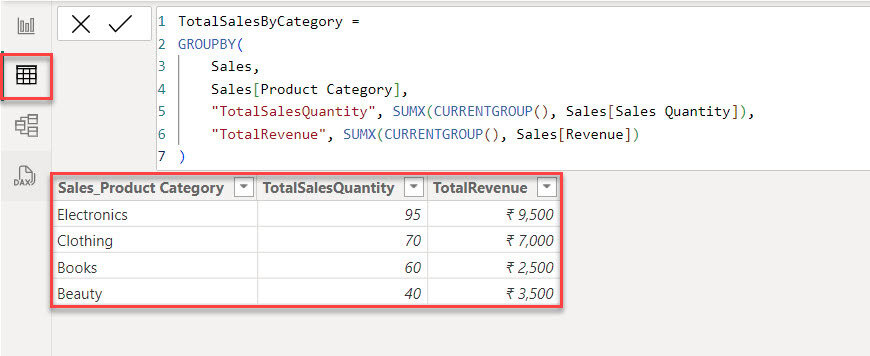
Power BI Group by | Power BI Count Group by

How to Use GROUPBY DAX Function in Power BI

In this Power BI Tutorial, we will learn about the Power BI Group By function and Power BI Count Group By. Also, we will cover the topics below: Power BI Group By function Power BI GROUP BY is a function used in the query editor or in DAX (Data Analysis Expressions) to combine data based … read more…
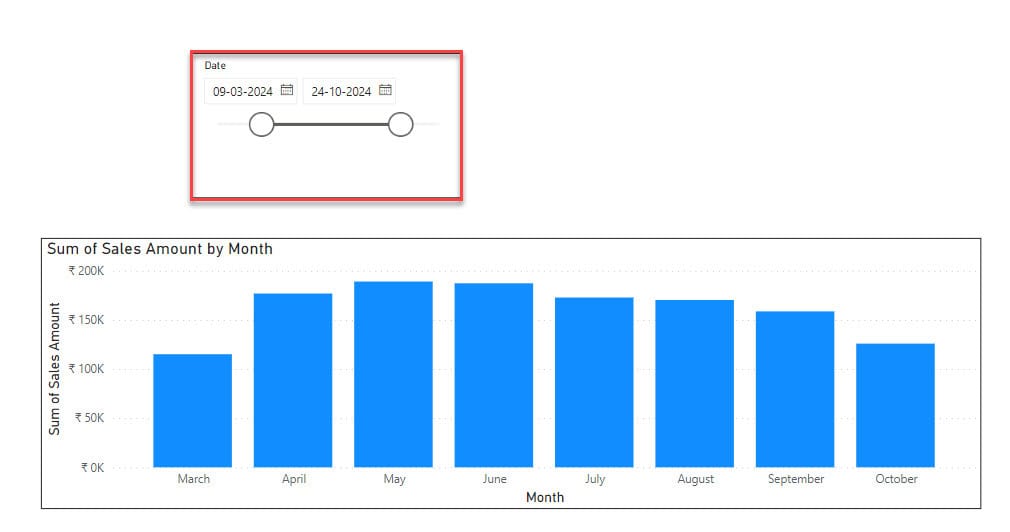
Power BI Date Slicer [11+ Examples]

How to use Power BI Date Slicer

A Power BI Date Slicer is like a magic wand for your data. It lets you easily filter and visualize your data based on dates. Think of it as a virtual tool that helps you slice and dice your data by time periods such as days, weeks, months, or even years. In this tutorial, we … read more…

Power BI Split Column by Text Contains | Power BI Split String

Split Column in Power BI

When working in Power BI, you might encounter a situation where your data has merged columns, such as having too much information in one column, like “PowerBIDesktop.“ In that case, you can use Power BI’s Split Column option to divide that column into multiple columns, like “Power BI Desktop.“ In this tutorial, we will learn … read more…

Power Query Date Functions | Power Query Today

power query date minus 1 day

One common task in data analysis is working with dates. Power BI Power Query provides functions for working with dates, including getting the current date and other date-related functions. In the tutorial, I will discuss Power Query Today Date in Power BI and Power Query Today Minus 7 days. Also, we will cover the topics … read more…

Power BI Power Query Examples [Complete Tutorial]

power bi query tutorial

In this Power BI tutorial, I will explain all about Power BI Power Query examples, Power Query m Language examples, and Power Query Advanced Editor examples. Also, we will cover the topics below: What is Power Query in Power BI? Power Query is a feature within Power BI (also available in Excel) that allows users … read more…

Power Query Create Table in Power BI + Examples

power query create table from scratch

The Power Query Editor in Power BI is a strong tool for transforming data. It helps you clean and manipulate data right within Microsoft Power BI. In this tutorial, I will explain how to create table in power query, including: Power Query Create Table To create a table in power query, follow the steps below: … read more…

Switch in Power BI | Switch in DAX

power bi switch statement

When we discuss Power BI logical functions, we usually start with the IF function. But there is a problem: the IF function becomes more complex if we have multiple conditions. That’s where the Power BI Switch function comes in handy. In this tutorial, we will discuss the Switch function in Power BI and the switch … read more…

This content isn’t available. Learn more about Power BI [Solved]

this content isn't available. learn more about power bi

One of my subscribers emailed me recently. When they tried to publish their report on the web, they got an error message saying, “This content isn’t available. Learn more about Power BI.“ In this Power BI tutorial, we’ll talk about how to fix an error message that says, “This content isn’t available.” Power BI Error: … read more…

How to Apply Conditional Formatting in Power BI Pie Chart?

Power BI Pie Chart Conditional Formatting

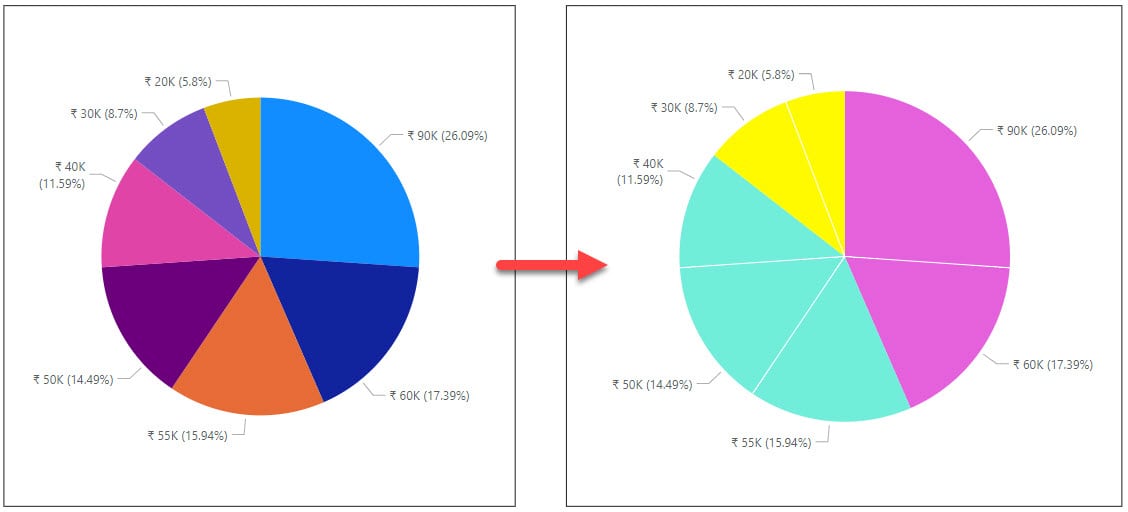
The Power BI Pie chart has one drawback. We can not find any conditional formatting option because it is unavailable in the chart. However, we have an alternative way to apply conditional formatting to the Power BI Pie chart. In this tutorial, I will explain how to apply conditional formatting in Power BI pie chart … read more…

Power BI If Statement | If Contains Power BI

dax if statement

In Power BI, you can use the IF function in two ways: with the DAX function and in the Power Query editor. In this tutorial, I will explain Power BI IF statement, how to use if statements in Power BI and Power BI if statements with text. Also, we will see the topics below: IF … read more…

Line Chart in Power BI – How to Create & Use

how to create a line chart in power bi

Power BI offers many built-in charts to visualize data; creating them is easy with just a few clicks. Among these charts, the Power BI line chart is great for showing data trends over time. In this tutorial, I will explain line charts in Power BI and how to create a line chart in Power BI … read more…

Power BI Slicer Sort Descending [With Examples]

power bi slicer order descending

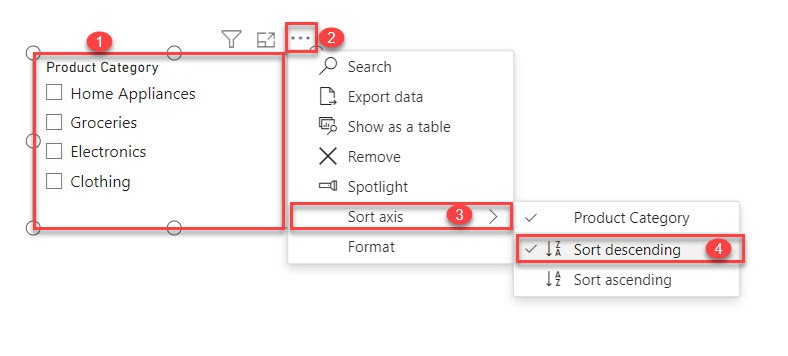
It’s common for Power BI users to sort their data set when they’re analyzing. In this tutorial, we will learn how to sort descending in Power BI Slicer. I’ll also show you how to sort slicer values based on numeric values in Power BI and Power BI sort date slicer descending. Additionally, we will learn … read more…

>